Same Projection, Different Confidence
February 2026
Two pitchers can project to the same WAR and still feel very different. One looks like a stable mid-rotation arm, the kind you expect to give you about what the projection says. The other comes with a lot more questions.
This difference is usually explained through intuition. A longer track record, steadier velocity, or a better pitch mix tends to give more confidence, while recent breakouts or injuries tend to do the opposite. Those cues can be useful but are not always reliable. Additionally, many publicly available projection systems, like ZiPS, provide only a single forecast in the standard tables they publish, even if the underlying models consider percentile outcomes. As a result, users don't have a straightforward method to measure uncertainty to accompany those point estimates.
A single WAR estimate hides an important distinction. Two nearly identical projections can reflect very different ranges of realistic outcomes. In what follows, I will look at a pair of pitchers with familiar forecasts but very different uncertainty and explore why a model is confident in one projection and less certain about the other.
To do this, I use a model that is given a player’s previous season statistics and produces a single WAR estimate as well as a range of plausible outcomes for the next season. Rather than treating each projection as a precise point, the model is trained to capture how wide that range needs to be to account for variation in performance. These ranges are what I refer to as intervals. I estimated next season WAR intervals using Conformalized Quantile Regression: gradient-boosted models predict the 5th and 95th percentile outcomes, and a calibration step to widen or tighten those ranges based on validation data. In testing (tested on 2025 starting pitchers), 83% of pitchers’ true next season WAR fell within the nominal 90% prediction intervals. While this indicates under coverage, this result is consistent with finite sample variability. Importantly, coverage was stable across most parts of the distribution and interval width varied meaningfully with pitcher profiles rather than collapsing to a consistent value.
Case Study: Bassitt vs Kirby
Consider two pitchers who based off my model were projected to produce nearly identical WAR in 2025: Chris Bassitt and George Kirby. My model projected Bassitt to produce 1.8 WAR and 1.7 WAR for Kirby. Close enough that on the surface they would be valued similarly.
ZiPS projected Bassitt for 1.9 WAR, and he went on to produce 2.4 WAR in 2025. Kirby entered the year with a higher ZiPS projection of 3.6 WAR but also finished at 2.4 WAR in 2025. Both pitchers ended the season in the same place, despite arriving there through very different expectations.
Where they mainly differ is in the range of outcomes surrounding that projection. My model forecasted Bassitt to have a relatively narrow interval of 3.2 WAR, while Kirby’s interval was among the widest at 5.9 WAR. The point estimate projections are about the same, however the outcome distributions behind them are not.
This gap matters as a narrow interval suggests that most of the model’s plausible scenarios cluster tightly around a projection. A wider interval reflects a broader range of realistic outcomes, with the potential for more extreme outcomes relative to the point estimate. Both pitchers may project similarly but the paths that they could take may look very different.
Before digging into why the model treats these two pitchers differently, it’s worth clarifying what these intervals represent. These are prediction intervals for next season outcomes, not confidence intervals around a player’s talent. A wider interval does not mean a pitcher is likely to fail. Instead, it reflects how difficult it is for the model to pin that pitcher down to a narrow range of outcomes given the information it has.
Why the model sees these pitchers differently
To better understand what drives uncertainty in aggregate, I trained a lightweight explainer model on the resulting interval widths. This analysis is intended to highlight broad trends rather than provide a causal or player specific decomposition. Importantly, this explainer model is separate from the forecasting model itself and is used only to summarize patterns in interval width.
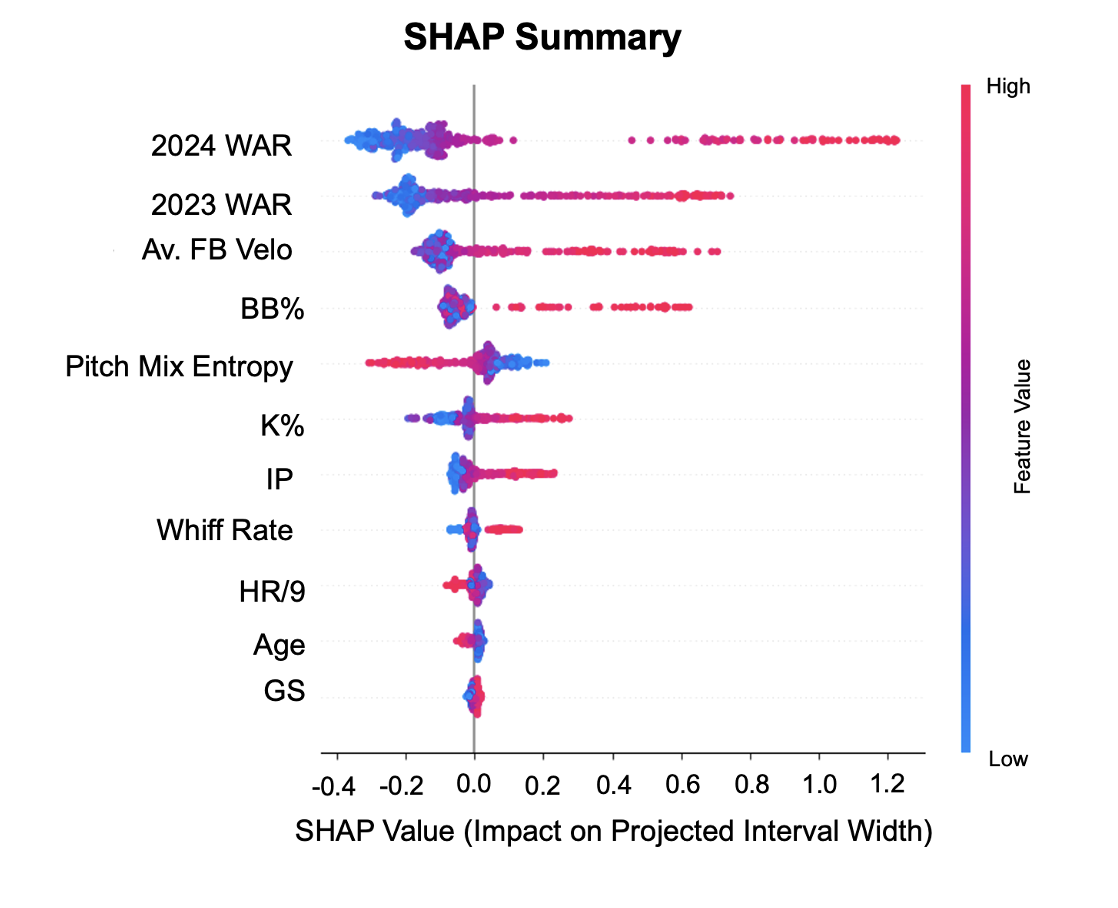
Each point represents a pitcher season. Features are ordered by how much they matter for interval width, and the horizontal point position show whether a given feature value pushes the interval wider (positive) or narrower (negative).
First, players with higher previous season WAR tend to be associated with wider intervals. This likely reflects a combination of health and playing time uncertainty rather than volatility in underlying talent alone. As a result, higher recent performances are associated with a broader set of plausible outcomes rather than a tighter one.
Second, fastball velocity and walk rate also are associated with wider intervals. Higher velocity can raise a pitcher’s ceiling, but it can also introduce some volatility, whether through health risks or small changes in command. Similarly, higher walk rates can introduce more volatility as shifts in control can change a pitcher’s effectiveness in run prevention.
Finally, pitch-mix entropy moves in the opposite direction. Pitch-mix entropy was calculated based off Ben Perry’s work on Pitch Mix Variation and Ways to Measure it. Pitchers with more diversified arsenals (higher pitch-mix entropy), those who rely on multiple pitches rather than a small mix, tend to get narrower intervals.
Although both pitchers project to a similar WAR, they arrive there through very different profiles. Bassitt entered 2025 with more modest recent performance, posting WAR totals of 2.6 in 2023 and 2.3 in 2024, alongside a lower average fastball velocity of 92.4 MPH in 2024. He also featured an above average pitch mix, with a pitch mix entropy of 2.5 (league average is 1.9).
Kirby’s profile looks different as he posted a higher WAR in each of the previous two seasons (4.2 in 2023 and 4.1 in 2024) and paired that with a higher average fastball velocity of 96 MPH in 2024. His pitch mix entropy 2.1, while still above league average, suggests a somewhat more concentrated arsenal compared to Bassitt. Those inputs raise Kirby’s expected value while also introducing more sensitivity to small changes in health, command, or pitch effectiveness.
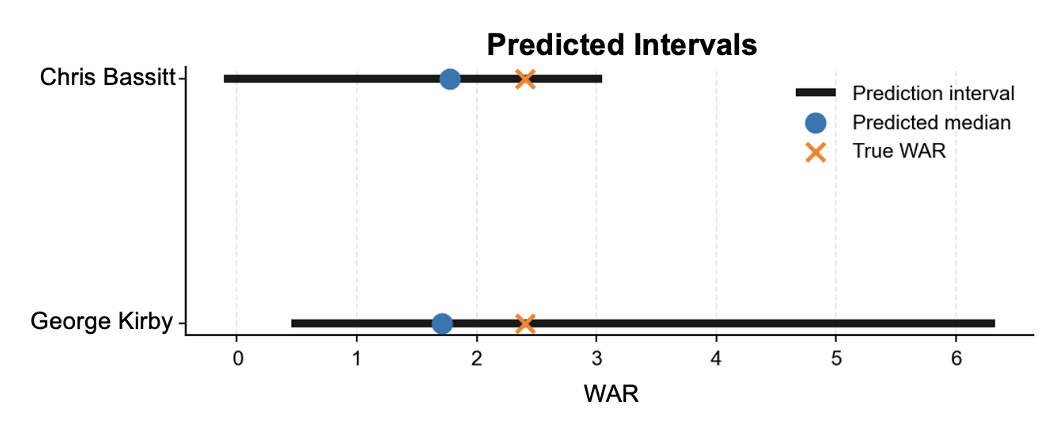
As shown in Figure 2, Kirby’s projection spans a much wider range of plausible outcomes than Bassitt’s, driven primarily by a substantially higher ceiling. Bassitt’s interval is narrower and more symmetric around the median, while Kirby’s distribution allocates more probability mass to high end outcomes. The expected value is similar, but the uncertainty and shape of the uncertainty is not.
A wide prediction interval should not automatically be interpreted as a negative signal. In Kirby’s case, the wide interval indicates uncertainty about the lower WAR projection. While the interval does include some downside risk, it also implies that Kirby could substantially outperform his projection. For teams who are willing to tolerate volatility, this uncertainty can represent upside optionality rather than purely risk.
Conclusion
The takeaway here is not that one of these pitchers is safer or riskier in an absolute sense, nor that projection systems are failing when outcomes differ from expectations. Rather, it’s that point estimates alone hide meaningful differences in how projections are constructed.
Two pitchers can project to the same WAR while carrying very different ranges of plausible outcomes. In this case, one projection is built on a narrower, more redundant set of inputs, while the other depends more heavily on higher ceiling traits that introduce greater sensitivity to changes in health, command, or effectiveness. The expected value may be similar but the uncertainty behind it is not.
Front offices rarely choose between pitchers based on point estimates alone. Contract structure, roster depth, and contention windows all depend on downside risk as much as upside. Even when two pitchers project to the same WAR, understanding how uncertain that projection is can meaningfully change decisions.